
Markets & Growth
Seasonal Demand Forecasting With Almost No Data: A Practical Range for Makers
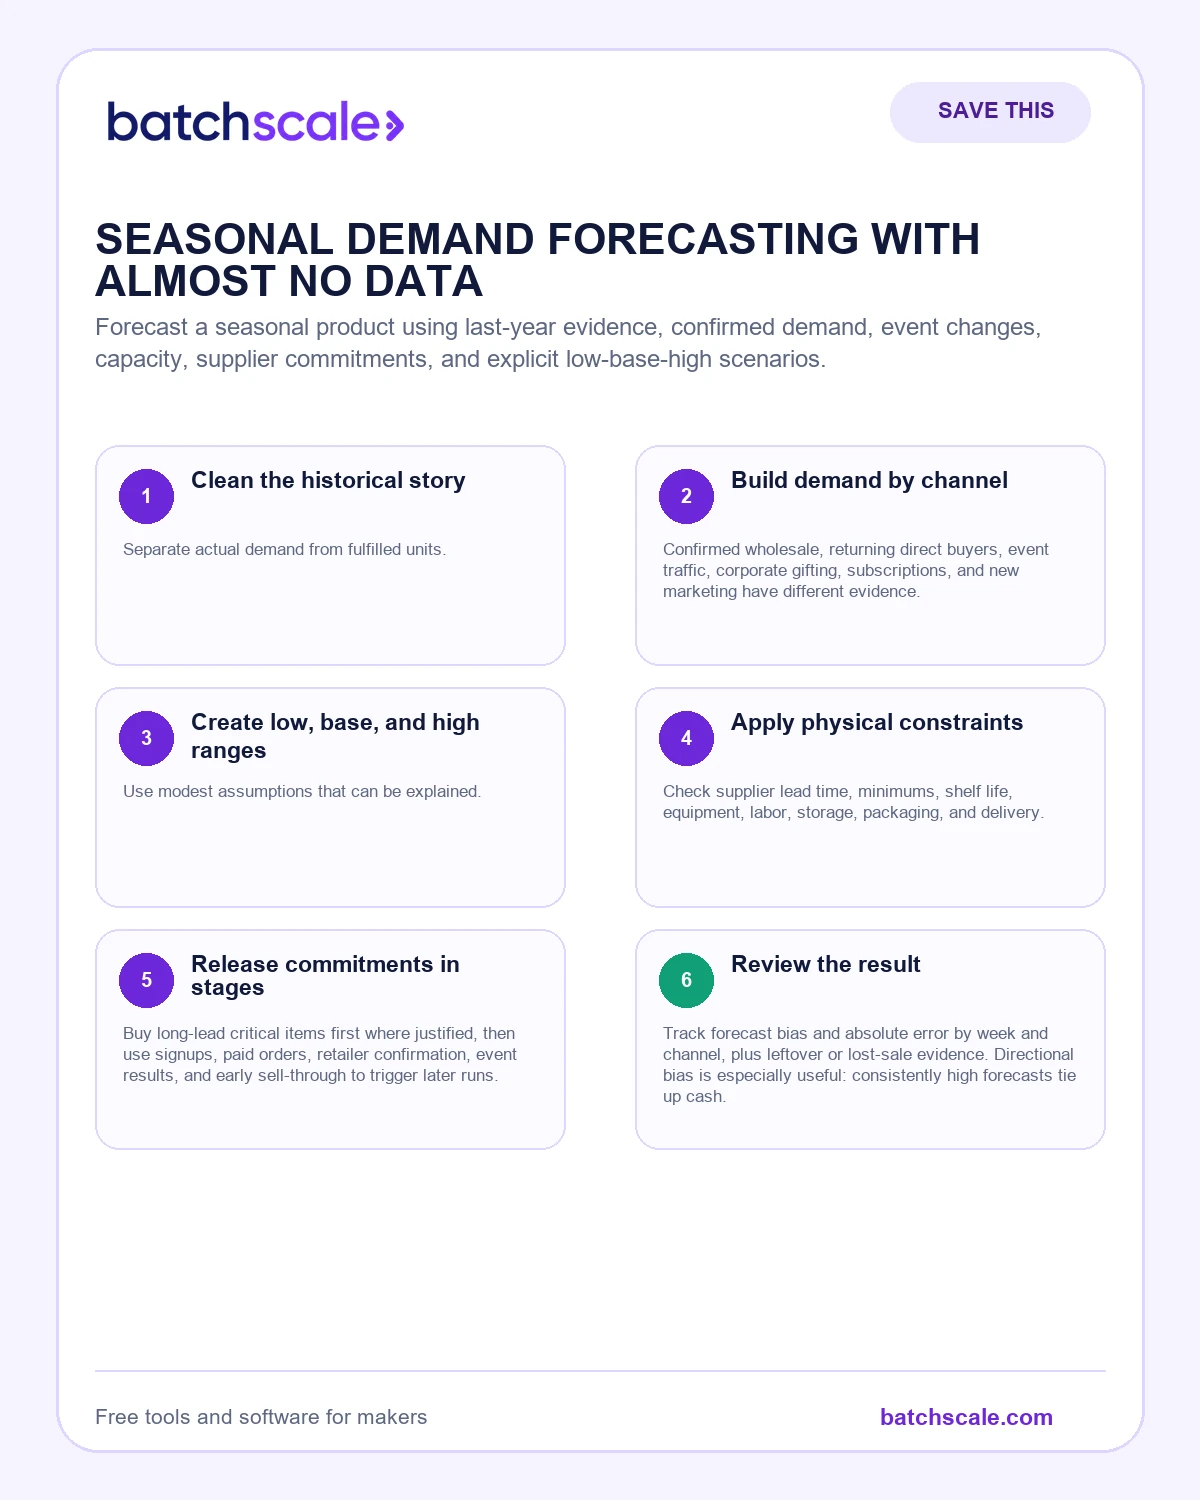
Forecast a seasonal product using last-year evidence, confirmed demand, event changes, capacity, supplier commitments, and explicit low-base-high scenarios.
A small maker rarely has the clean history a forecasting textbook expects. Last year may include a viral post, one cancelled market, a late launch, a stockout, or a product that changed size. This year has different retailers, prices, lead times, and capacity.
Sparse data does not justify a single confident guess. It calls for a range with named assumptions. The business can distinguish confirmed demand, likely repeat behavior, event exposure, new-channel upside, and supply or capacity limits.
The forecast becomes a decision tool when it shows what must be purchased now, what can wait for stronger evidence, and what signal will trigger the next production release.
The quick answer
The outcome is a weekly range, confirmed-demand block, capacity ceiling, staged purchase plan, and explicit trigger for each additional run. Begin with Collect prior weekly units, unavailable days, price, promotion, channel, event, weather note, wholesale confirmation, returns, and leftover quantity. Add this season’s committed orders and capacity. The first operating priorities are clean the historical story and build demand by channel; the working system then has to support create low, base, and high ranges, apply physical constraints, release commitments in stages. Keep the scope narrow enough that the decision can be tested with real evidence instead of debated through general opinions.
What this looks like in a real maker business
A confectioner sold 600 holiday boxes last year but was out of stock for ten days. This year’s price is higher, one large market is gone, and two corporate buyers have confirmed 180 boxes. Rather than adding a stockout estimate to 600, the maker builds low, base, and high scenarios by channel, reserves confirmed orders, stages packaging buys, and sets weekly release triggers.

The practical playbook
Clean the historical story
Separate actual demand from fulfilled units. Mark stockouts, launch date, price, discounts, channels, events, weather, wholesale orders, and product changes. Missing sales during a stockout are unknown—not automatically equal to the busiest day.
Put it to work: Annotate last season week by week before calculating growth.
Build demand by channel
Confirmed wholesale, returning direct buyers, event traffic, corporate gifting, subscriptions, and new marketing have different evidence. Forecast each separately and avoid counting the same customer twice.
Put it to work: Name the source and confidence for every demand block.
Create low, base, and high ranges
Use modest assumptions that can be explained. The low case protects cash, the base case drives the working plan, and the high case defines capacity and replenishment response.
Put it to work: Use the demand forecast calculator and save the assumptions, not only the answer.
Apply physical constraints
Check supplier lead time, minimums, shelf life, equipment, labor, storage, packaging, and delivery. Demand above feasible output belongs in a waitlist or later promise, not invisible overtime.
Put it to work: Calculate maximum good output by week and compare it with each scenario.
Release commitments in stages
Buy long-lead critical items first where justified, then use signups, paid orders, retailer confirmation, event results, and early sell-through to trigger later runs.
Put it to work: Write trigger quantities and dates before the season begins.
What can go wrong
Do not create false precision by applying a growth percentage to one noisy season. Document cannibalization, overlapping promotions, and channel shifts. For perishable or date-sensitive products, the cost of excess may exceed the cost of a controlled sellout.
A useful safeguard is to keep the original source record beside the interpretation. If an order, count, supplier date, batch result, customer message, or payment changes, update the decision and preserve why it changed. This prevents a confident dashboard from drifting away from the physical business.
The number that keeps this honest
Track forecast bias and absolute error by week and channel, plus leftover or lost-sale evidence. Directional bias is especially useful: consistently high forecasts tie up cash.
Use the number as a decision signal, not a performance weapon. Review the definition, compare similar periods, and pair it with quality and customer evidence. A metric becomes dangerous when people improve the displayed result by moving work, cost, or failure outside the measurement.
A simple 30-day implementation
Week 1: establish the baseline
Gather the records described above and keep uncertainty visible. Use actual orders, batches, counts, supplier confirmations, and payment records wherever possible. Mark estimates instead of polishing them into false facts. Choose one product, channel, or workflow narrow enough to finish in a week. A completed small baseline teaches more than a company-wide workbook nobody trusts.
Week 2: change one operating rule
Translate the first two playbook steps into a rule with an owner, trigger, input, decision, and expected output. Save the previous method. Explain the change to everyone whose work or promise is affected. If the rule touches safety, compliance, employment, tax, contracts, or regulated claims, pause for qualified guidance before using a general article as authority.
Week 3: run the rule in real work
Use the rule through a normal cycle. Record exceptions when they happen; do not repair the record after the fact. Keep customer commitments and required controls intact. One exception may be ordinary variation. Repeated exceptions usually mean the threshold, instruction, source data, authority, or capacity assumption needs revision.
Week 4: review the evidence
Compare the baseline with the metric in this guide. Ask what improved, what moved somewhere else, and what new burden appeared. Keep the rule, revise it, or remove it. Write the decision, owner, and next review date. That short history becomes operating memory and prevents the same debate from restarting whenever the founder is tired.
When connected software becomes useful
Spreadsheets and checklists are excellent for learning a method. They become fragile when the same product, formula, material, batch, order, customer, and cost must be updated in several places. Duplicate entry creates version disagreement; delayed entry makes reports look precise while the floor works from different facts.
Connected software should not automate confusion. It should preserve the current product version, show available and committed inventory, connect production with actual material and yield, carry costs into channel decisions, record who changed what, and make exceptions visible. Start with the decision that currently requires the most reconciliation. Add the next workflow only after the first source of truth is dependable.
Questions to ask before you scale the change
- Can a trained person explain the rule and the reason behind it?
- Is the required source data available at the moment the decision is made?
- Does the rule protect product quality, customer expectations, and applicable obligations?
- What evidence would prove the change is helping rather than moving cost elsewhere?
- Who owns an exception, and how quickly must they respond?
- Can the business export the records and reconstruct what happened later?
Growth becomes calmer when decisions leave a trail. The objective is not more administration. It is fewer avoidable surprises and a business that can repeat what works.
Related tools and reading
The bottom line
The outcome is a weekly range, confirmed-demand block, capacity ceiling, staged purchase plan, and explicit trigger for each additional run. Choose one product or workflow, establish the baseline, and make one observable change. Review the result after a real cycle. Clear evidence, a responsible owner, and a next review date will outperform a dramatic overhaul that the business cannot sustain.
Explore all free tools for makers, browse the Batch Scale resource center, or see how Batch Scale connects costing, inventory, production, orders, and customers.