
Costing & Pricing
The Maker Profit Map: 12 Numbers Every Product Business Should Know
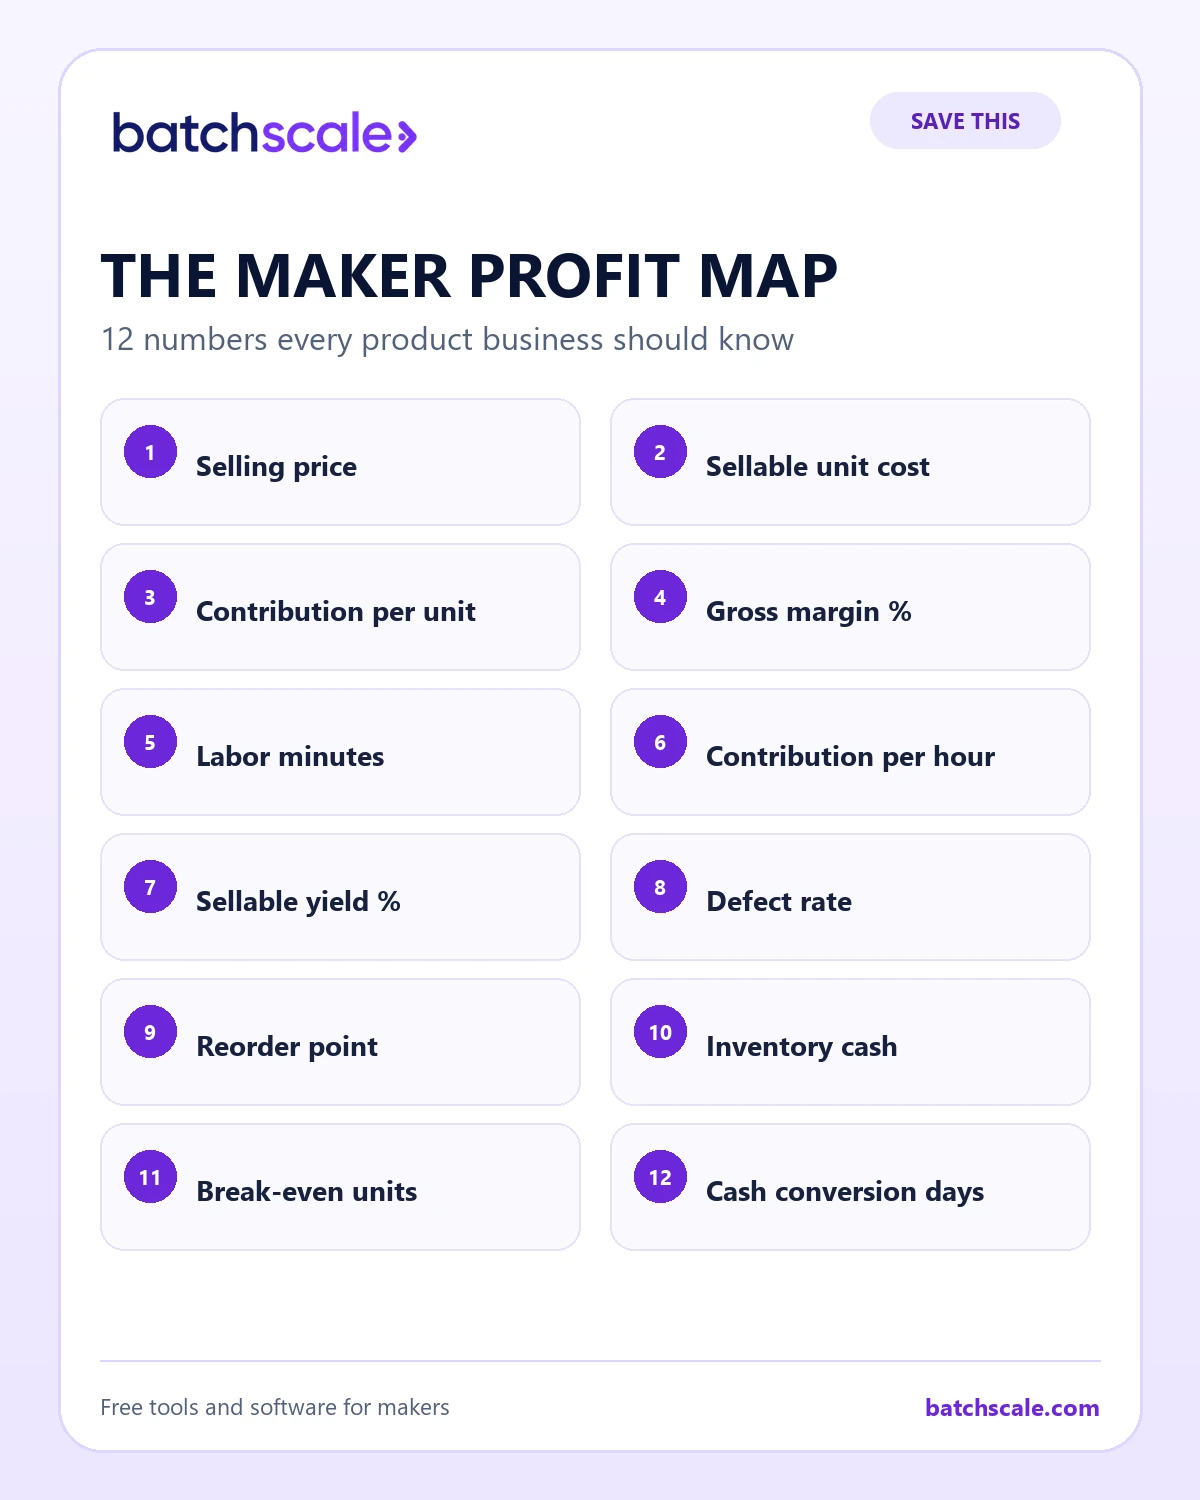
A visual, practical map of the twelve numbers that connect product demand, unit economics, capacity, inventory, quality, and cash.
A maker can know the bank balance, last month's sales, and the price of every product—and still be unable to answer the next operating question. Can we afford the wholesale order? Which SKU deserves Friday's production hours? When should we reorder jars? Did the sellout create profit or merely consume inventory bought months ago?
The Maker Profit Map connects twelve numbers that are often kept in separate spreadsheets or not measured at all. No single number is the business. Together they reveal whether demand becomes healthy contribution, whether production converts inputs into sellable units, and whether profit arrives soon enough to fund the next cycle.
The infographic comes first because it is designed to be saved, shared, and used as a weekly review card. The article underneath explains how the numbers relate and where small product businesses commonly misread them.
The real-world pattern
A sauce maker celebrates a $9,000 month. The bestseller has a 62% gross margin using ingredient cost alone, so more production seems obvious. Once sellable yield, bottles, labels, payment fees, owner labor, replacements, and rush freight are included, contribution falls sharply. The sauce also consumes the bottling station that limits every other SKU. Revenue was real; the original conclusion was incomplete. The map turns one attractive percentage into a connected decision.

The practical playbook
Start with price, cost, and contribution
Selling price is what the customer pays before discounts and channel deductions. Sellable unit cost includes the resources required for a good unit. Contribution is the amount left after variable costs to pay fixed overhead and profit.
Put it to work: Calculate one normal order by channel with the product profitability analyzer. Do not average retail and wholesale economics.
Add margin and labor productivity
Gross margin percentage helps compare scale, while contribution per constrained labor hour shows what the scarce production time actually earns. A smaller-dollar item can outperform a famous product when it moves cleanly through the bottleneck.
Put it to work: Time setup, production, cleanup, inspection, and packing for a representative batch. Divide contribution by the hours of the limiting skill or station.
Measure yield and quality
Theoretical output is not sellable output. Track planned quantity, actual good units, normal waste, defects, rework, and replacements. Yield and defect rate explain why purchasing and costing drift even when the recipe looks unchanged.
Put it to work: Record the first-pass good quantity before rework. Give repeated defects a reason code that points to a process decision.
Connect stock to demand
A reorder point combines expected use during replenishment lead time with justified safety stock. Inventory cash reveals how much money is tied up in materials, work in progress, and finished goods rather than available for other obligations.
Put it to work: Count available and committed stock separately. Model the next order with the inventory investment calculator.
Finish with break-even and cash timing
Break-even units show the volume required to cover fixed costs at normal contribution. Cash conversion days reveal when money paid to suppliers returns as usable customer cash. A profitable cycle can still create a dangerous timing gap.
Put it to work: Build a weekly cash line from purchase commitment through processor settlement. Test the volume using the business break-even calculator.
What to watch
Do not create false precision. Label estimates, record definitions, and update the most sensitive assumptions after real batches. Percentages can conceal small dollar contribution, and monthly averages can hide a severe weekly cash gap. The map works when every number can be traced to an order, batch, count, or payment.
The number that keeps this honest
Use contribution per constrained hour as the tie-breaker when demand, margin, and capacity point in different directions. Review it beside defect rate and repeat demand so speed never purchases weak quality or a short-lived promotion.
Put the lesson to work without rebuilding everything
Choose one current product and one recent operating cycle. Gather the source evidence before changing the system: purchase records, actual material quantities, sellable yield, hands-on time, order history, refunds, defects, customer questions, and the cash that moved. Estimates are acceptable when clearly labeled, but replace the highest-impact estimate first. A small maker does not need perfect data; the business needs numbers reliable enough to support the next decision.
Write the decision in plain language. “Improve inventory” is a project with no finish line. “Set a reorder trigger for the vessel that can stop our bestseller before Friday” can be completed and tested. Name the product, owner, trigger, action, and review date. Use a checklist or spreadsheet if that is sufficient. Add software only when the same information must stay connected across orders, materials, formulas, production, purchasing, and more than one person.
Run a seven-day evidence sprint
On day one, document the current method without defending it. On day two, calculate the baseline result. On day three, identify the earliest point where information becomes uncertain or work begins to wait. On days four and five, make the smallest useful control: a specification, decision rule, capacity limit, cost field, status, template, or quality check. On day six, run it through a real order or representative batch. On day seven, compare the result and decide whether to keep, revise, or remove the control.
The sprint should answer one question, not digitize the company. Record unintended consequences. A faster packout that increases damage is not an improvement. A lower material price that demands too much cash or produces inconsistent batches is not automatically a saving. A popular offer that requires unpaid founder labor is not automatically a winner. Look at the entire promise from purchasing through customer acceptance.
Keep a decision-grade scorecard
Most topics in this guide can be monitored with a short weekly scorecard:
- demand: qualified inquiries, orders, units, conversion, and repeat behavior;
- economics: net revenue, sellable unit cost, contribution, and contribution per constrained hour;
- delivery: promised versus actual completion and the age of open work;
- quality: first-pass yield, defects, rework, replacements, and the reason for each exception;
- inventory: available, committed, held, incoming, and days of practical coverage;
- cash: money committed before delivery, expected receipts, and obligations that are not spendable profit.
Not every business needs every measure. Choose the few that can change an action this week. Define each measure so the number cannot quietly change meaning. Compare normal cycles rather than a launch-day peak with a quiet Tuesday. Trends become useful only when the underlying definitions remain stable.
Build a rule for the tired version of you
A useful operating rule still works when the founder is busy. Write it as an if-then statement: if available stock reaches the reorder point, create the purchase decision; if requested customization exceeds the included revision, pause and re-quote; if practical capacity exceeds the agreed threshold, offer a later window; if a critical quality check fails, hold the affected work and investigate before release.
Test the rule against a recent surprise. Would it have prevented the late order, weak margin, shortage, or confusing customer exchange? If not, make the trigger more specific. If it creates ceremony around low-risk work, make it lighter. Good systems are not collections of forms. They make the correct action easier to recognize at the moment it matters.
Know when the system is ready to grow
Expansion should be earned by evidence: repeated full-price demand, a complete cost that pays sustainable labor, stable quality, a funded replenishment cycle, and a process that does not require emergency intervention every time. Before adding products, channels, equipment, or staff, name the constraint the investment will relieve and the result that will prove it worked.
Also define a stop or revision rule. Decide the maximum cash, time, defect rate, or delivery risk you will accept before pausing. This does not make the business less ambitious. It protects the resources required for the next good experiment. A clear no is often the system that preserves a better yes.
Questions for the next operating review
Before closing the review, ask whether the current offer and the current process describe the same promise. Marketing may still show an old package, quantity, lead time, option, or result after production has changed. Purchasing may use a new component that has not reached the specification. A customer-service reply may create an exception the schedule never received. Walk one recent order from the page the customer saw through the materials, batch, inspection, packout, delivery, and payment. Correct the earliest mismatch rather than adding another downstream reminder.
Then test the decision under three conditions: normal demand, a credible peak, and a disruption. The peak is not an imaginary viral month; it is the largest scenario supported by an event, wholesale conversation, seasonal history, preorder count, or campaign plan. The disruption should reflect a real vulnerability such as a long-lead package, unavailable founder skill, lower yield, carrier delay, or rejected material. Decide in advance which quantity, date, substitute, allocation, or communication rule changes in each condition.
Finally, review the human load. Count the steps that require memory, private messages, repeated copying, after-hours rescue, or one person's approval. Decide which should be removed, standardized, delegated, or made visible. Do not automate an unsafe or unclear decision merely because it repeats. Establish the rule and evidence first, then use automation to carry reliable information between steps.
Before the next cycle begins, make the change observable. Save the old baseline, the new rule, the person responsible, and the date when the team will review the outcome. Tell affected customers or partners when the change alters a promise, lead time, quantity, specification, or price. During the cycle, capture exceptions without treating every exception as a reason to abandon the rule. At review time, separate normal variation from a recurring failure. Keep the change when it improves the intended result without moving unacceptable cost or risk somewhere else. Revise it when the direction is right but the trigger, threshold, or instruction is weak. Remove it when it adds work without improving a decision. This simple record creates a reusable operating memory and gives future teammates the reason behind the process, not only the latest version of a checklist.
The review is complete when it produces an owner, action, and date. Keep a short record of the decision and the result after the next cycle. That history prevents the business from reopening the same debate every month and turns ordinary operations into a durable body of knowledge. Share the rule with everyone affected, confirm that they can follow it with the information available, and revise any instruction that depends on unspoken founder knowledge.
The bottom line
The purpose of operations is not to make a small business feel corporate. It is to protect the product, the customer, the cash, and the people doing the work. Choose one action from this guide, assign it to a real product and date, and review the evidence after the next cycle. Consistent learning compounds faster than dramatic reinvention.
Explore the complete library of free tools for makers or see how Batch Scale connects the work.